Exploring the CCNA Score Report: What's Behind the Numbers?

While I was gathering data for the previous article in the Exploring CCNA series, I saw many people share their successful experiences online, and they also offered their scores at the same time, so the majority of the results were passed reports. However, there were a few brave people who shared their failure experiences as well. Cisco no longer provides a passing score and instead only gives you a percentage of each topic to tell you how well you did. Even though the score report includes a pass or fail status, it can still be a little confusing, especially if you, unfortunately, failed the exam and then found someone's score may look like yours, or even worse than yours, but they passed yet, which is very frustrating! What does the score report mean? How should I prepare for the next exam? To answer these questions, I decided to find out the performance and patterns behind these numbers through data analysis.
Calculate Weighted Score
I extracted score numbers from the gathered posts, such as:
Network Fundamentals:85% Network Access:80% IP Connectivity:96% IP Services:70% Security Fundamentals:40% Automation and Programmability:80%Every topic has a percentage from the data above, but it only represents the topic's performance and cannot show the overall performance of the CCNA exam. We can weight the scores according to the weight of each topic in CCNA's blueprint and then calculate an overall score. like this:
CCNA Score Calculator
Finally we can get the following data:
| Network Fundamentals | Network Access | IP Connectivity | IP Services | Security Fundamentals | Automation and Programmability | Weighted Score | Exam Result |
|---|---|---|---|---|---|---|---|
| 90% | 85% | 96% | 70% | 73% | 100% | 87% | PASS |
| 95% | 95% | 88% | 80% | 87% | 90% | 90% | PASS |
| 75% | 60% | 64% | 70% | 60% | 80% | 67% | PASS |
| 45% | 55% | 36% | 50% | 27% | 40% | 42% | FAIL |
| 85% | 80% | 96% | 70% | 40% | 80% | 78% | PASS |
| ... | ... | ... | ... | ... | ... | ... | ... |
📅 This article's data and content are regularly updated. As of , we've collected 487 scores.
Next, I will use several statistical methods to analyze these data and will be looking at the following:
- How does each exam topic perform among all candidates?
- Do the candidates on average score significantly better or worse at certain exam topics?
- Are there any significant relationships between performance on exam topics and final weighted scores?
- What are the significant differences between failed exam scores and passed exam scores on each exam topic?
Topic Performance Distribution
I create these histograms for each exam topic to visualize the distribution of scores, including passed and failed reports. These histograms will help us understand the spread of scores and the differences between passed and failed scores.
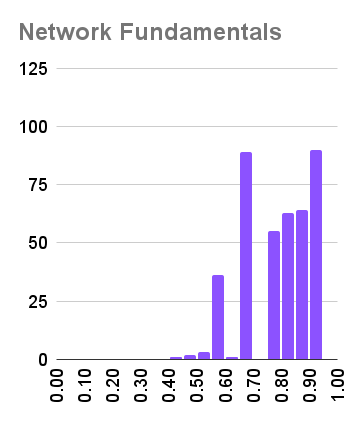
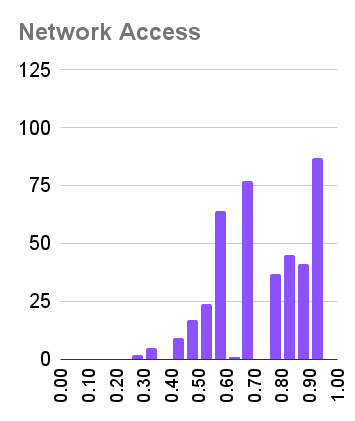
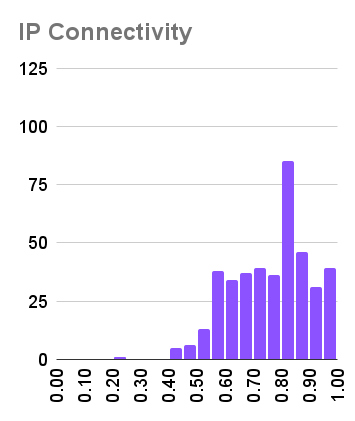
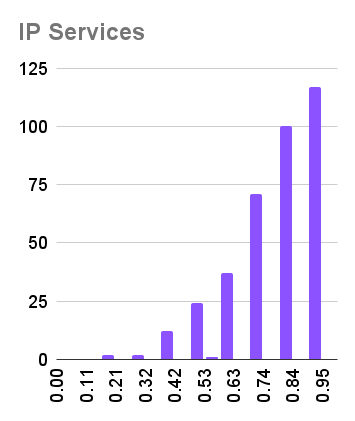
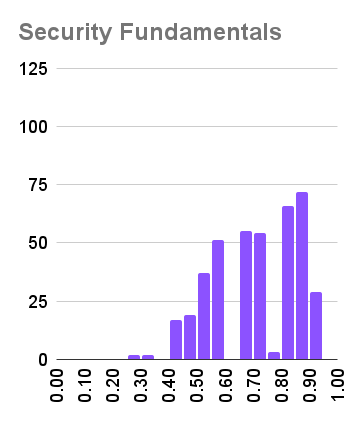
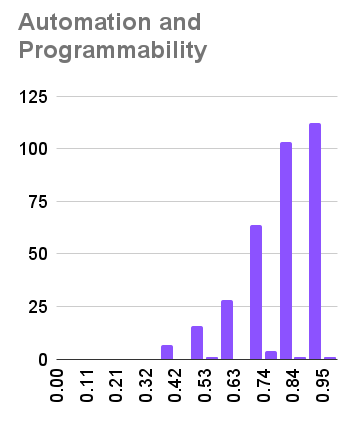
Most of the passed scores distribution are negative skew(left-skewed), and we can see that all the candidates who have passed the exam have a good performance on almost every exam topic. This indicates a high level of competency among successful candidates, as lower scores (below 50%) are rare. The concentration of scores in the higher range suggests that the exam effectively filters for candidates who demonstrate strong proficiency, and passing likely requires solid performance across multiple topics rather than excelling in just one area.
Candidates consistently demonstrate strong performance in Network Fundamentals and IP Connectivity topics, with most scoring above 80% and very few dipping below 70%. IP Service and Automation and Programmability topics show the highest scores, with a notable concentration of results between 90%-100%. But we can also see that the candidates' scores on the Security Fundamentals topic were significantly lower than others.
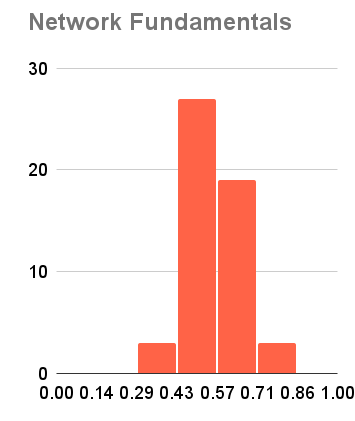
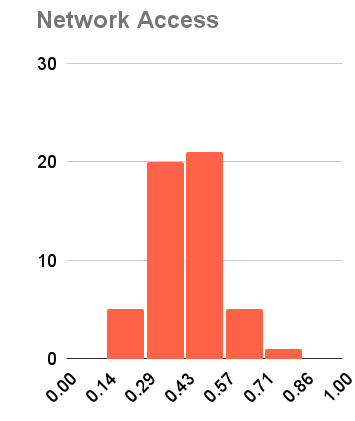
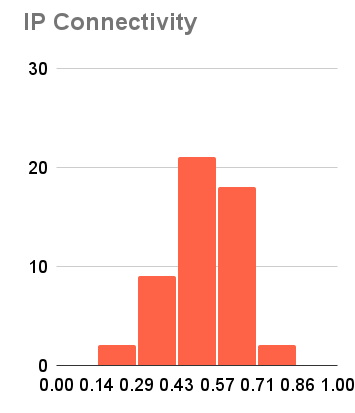
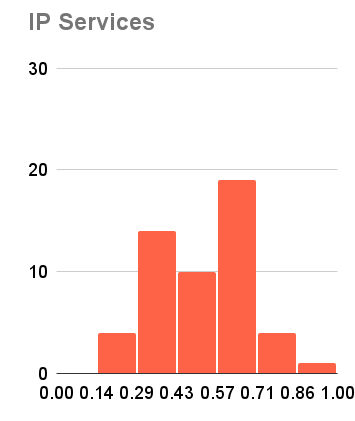
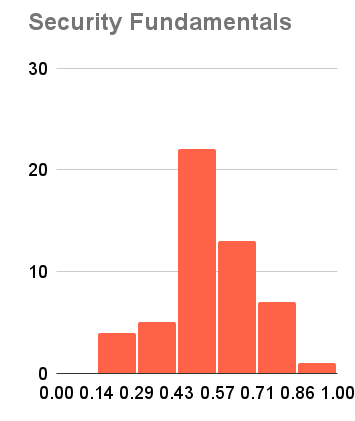
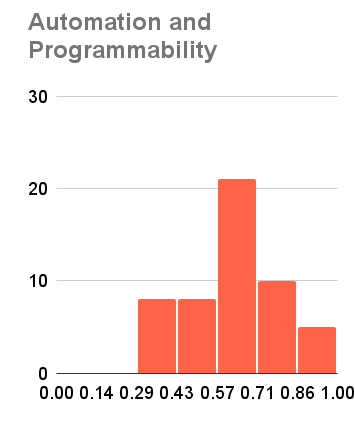
Most candidates who didn't pass the exam scored between 40% and 60% on the majority of topics. However, scores for IP Service and Automation and Programmability were slightly higher, peaking between 57% and 71%. This might suggest these topics are comparatively less challenging for those who struggle, though it's notable that IP Service also shows a secondary peak of lower scores, ranging from 29% to 43%, indicating a broader spread of performance. Since the data on exam failures is relatively limited compared to passes, it may not offer a complete picture and should be considered for reference only.
Now, let's look at the distribution of Weighted Scores.
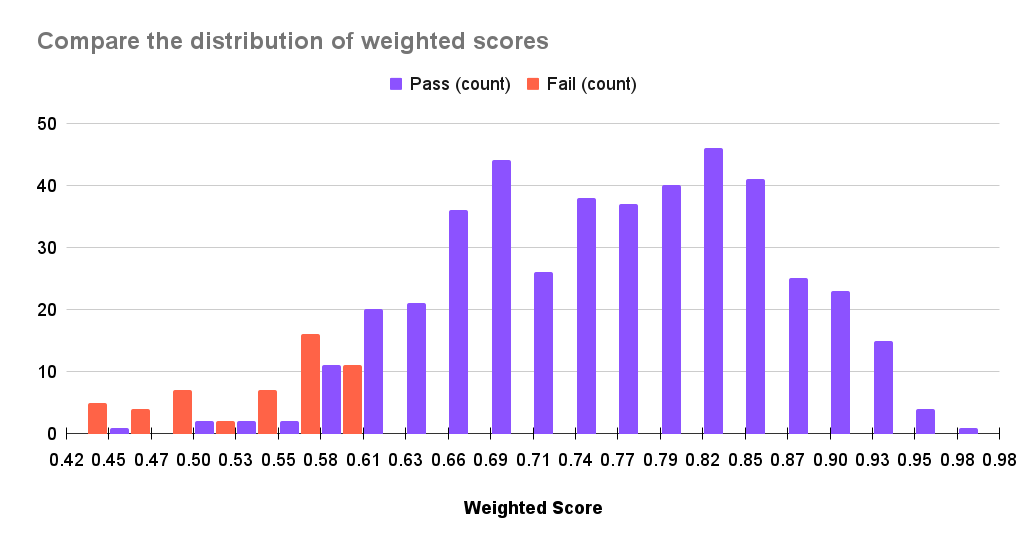
We can see that the approximate "passing mark" of CCNA is around 61%. Above this score, there is no failure. Many candidates who didn't pass the exam were quite close to the passing threshold. Conversely, the distribution of scores for passing candidates is more spread out, forming a bell-shaped curve. This indicates a significant range in performance among those who pass, from those just meeting the requirements to those who truly excel.On the other hand, it is worth noting that the weighted score is not the same as the real score. The weighted score merely reflects comprehensive topic mastery and should not be used as the definitive passing criterion. . The data in the figure above illustrates this problem well: the weighted scores of a small number of people who passed the exam are even lower than those who failed the exam. This occurs because exam designers assign differential weight values to questions. Thus, even with a lower overall weighted score, candidates can achieve better actual scores by correctly answering questions with higher weight values!
Topic Average Scores
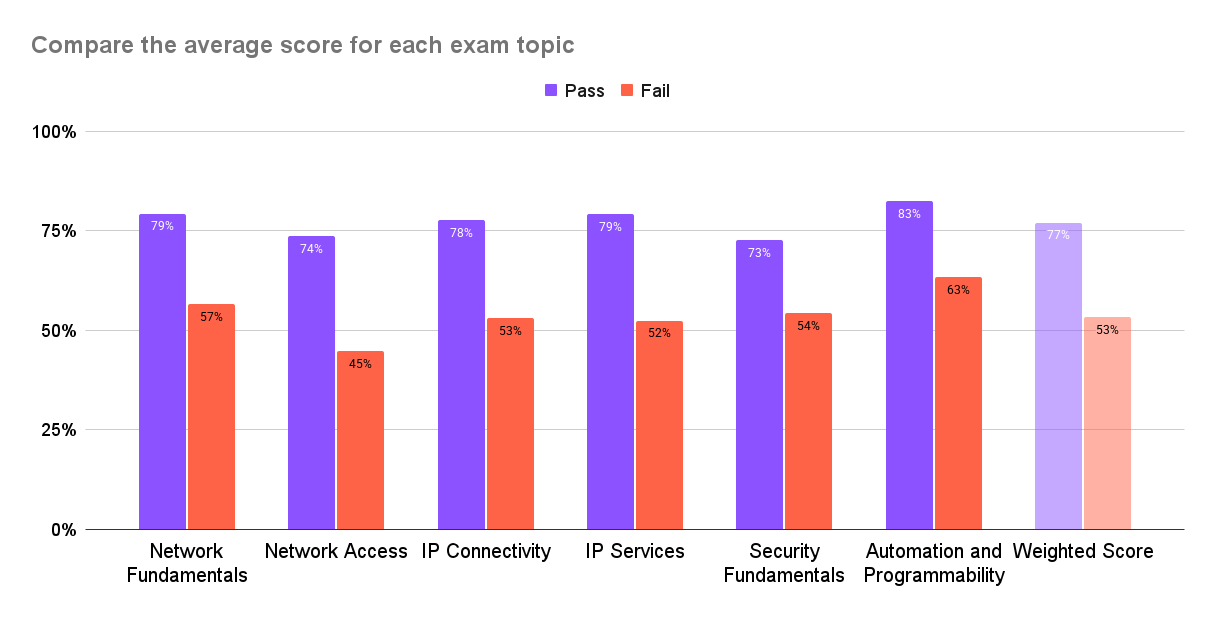
To find the best or worst performance on the exam topic, we calculated the average score for each topic, separating passed and failed reports. Additionally, we computed the differences between these average scores, along with their respective standard deviations.
| Topics | Averages | Standard Deviations | |||
|---|---|---|---|---|---|
| Pass Avg | Fail Avg | Difference | Pass StdDev | Fail StdDev | |
| Network Fundamentals | 79% | 57% | 22% | 0.122 | 0.102 |
| Network Access | 74% | 45% | 29% | 0.17 | 0.117 |
| IP Connectivity | 78% | 53% | 25% | 0.141 | 0.12 |
| IP Services | 79% | 52% | 27% | 0.162 | 0.18 |
| Security Fundamentals | 73% | 54% | 19% | 0.162 | 0.151 |
| Automation and Programmability | 83% | 63% | 20% | 0.146 | 0.16 |
| Weighted Score | 77% | 53% | 24% | 0.098 | 0.053 |
- Automation and Programmability stands out as the strongest performing topic in both successful and unsuccessful attempts, achieving the highest average scores and the narrowest gap between passing and failing candidates. However, its lower weighting (10%) means that strong performance in this area alone is typically insufficient for a pass.
- Network Access presents the lowest average scores, with 74% for passing candidates and 45% for failing candidates, resulting in a 29% gap. The high standard deviation (0.17) among passing candidates for Network Access indicates considerable variability in their performance within this topic.
- IP Services and IP Connectivity are also critical areas, exhibiting wider score gaps between passing and failing candidates than other topics. Notably, IP Services shows significant variability among failing candidates.
Overall, successful candidates consistently demonstrate superior performance across all topics, reflected in higher average scores and a lower standard deviation of the weighted average score. This suggests that while failing candidates might perform well in specific topics, their overall scores are often hindered by weaker topics. Conversely, achieving a passing score necessitates a solid and consistent performance across the entire range of topics.
Correlation Analysis of Weighted Score
We take a look at the correlation coefficients between each topic and the Weighted Score, specifically focusing on how these coefficients differ between "Pass" and "Fail" categories:
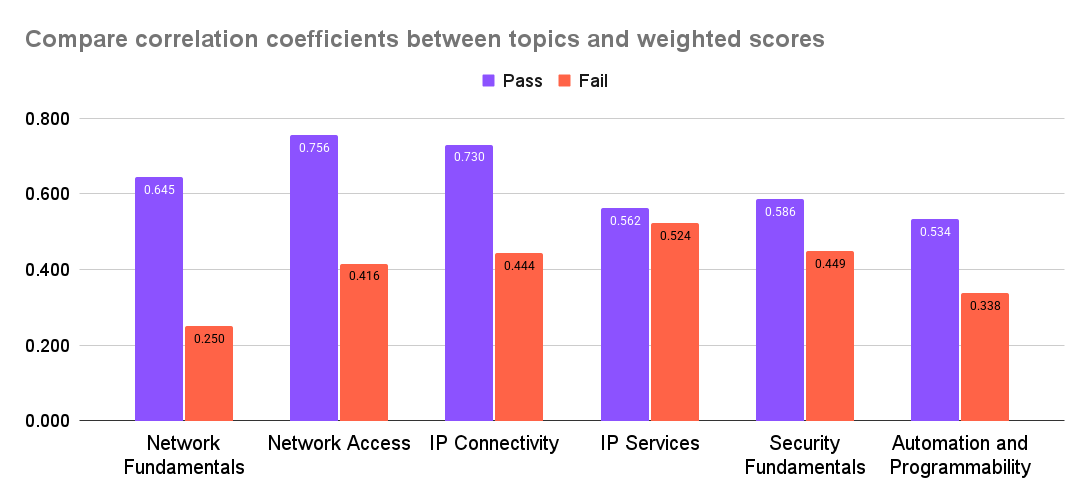
The correlation coefficients between each topic and the Weighted Score reveal distinct patterns:
- Network Access (0.756) and IP Connectivity (0.73) are the strongest predictors of success for passing candidates, emphasizing their critical role in achieving a high Weighted Score.
- Network Fundamentals (0.25 for Fail) stands out as a potential stumbling block for failing candidates, suggesting it’s an area needing extra attention.
- Passing candidates benefit from stronger and more uniform correlations across all topics, while failing candidates show weaker and more varied relationships, pointing to inconsistent preparation.
The Differences Between Passed and Failed Scores
This is a question that I am personally more interested in because CISCO will never tell you which questions you answered correctly and which ones you answered incorrectly. So, if I unfortunately fail the exam, how can I improve my score? I compared the topics of passed and failed reports using a Box plot:
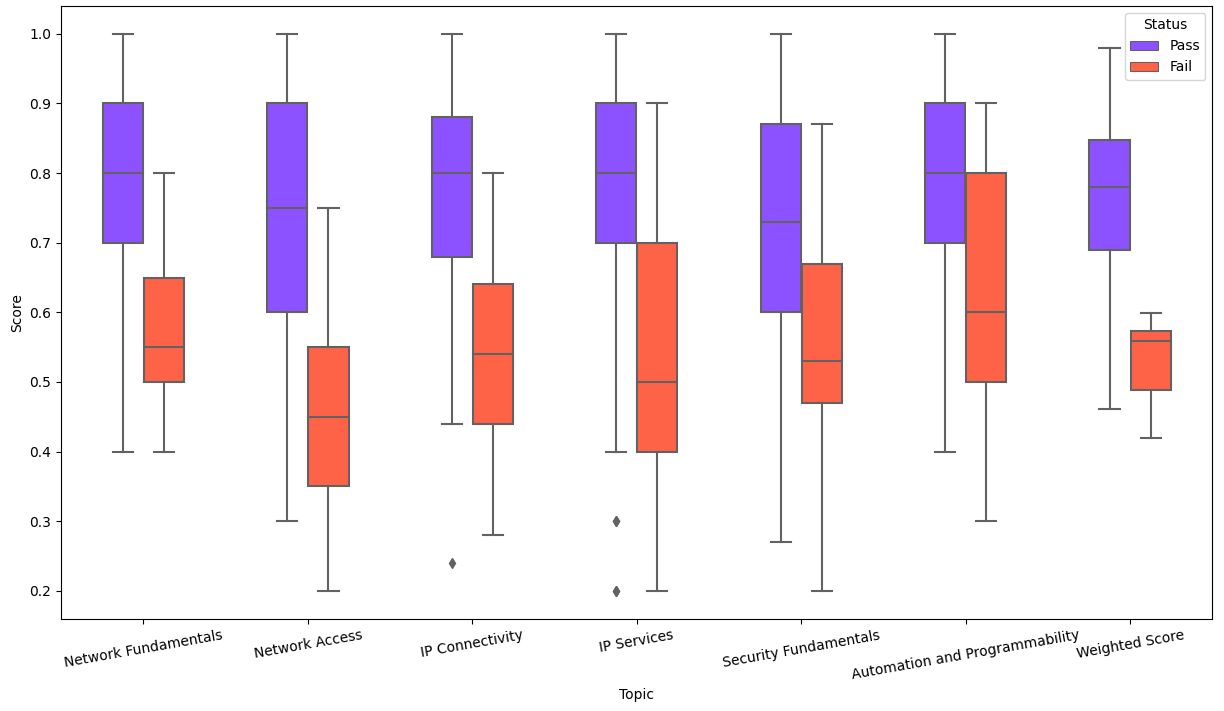
A box plot contains the minimum, first quartile, median, third quartile, and maximum from bottom to top. The height of the box indicates the concentration and variance of the data. When comparing the score distributions between passing and failing candidates, we observe significant gaps in Network Fundamentals, Network Access, and IP Connectivity. This indicates that successful candidates performed markedly better in these areas, which appear to be the primary struggles for those who did not pass. Conversely, The failed group performs relatively better in Security Fundamentals and Automation and Programmability. This suggests these topics might be less challenging for them, or perhaps they were better prepared in these specific areas. Consequently, these topics may be less decisive in determining overall exam success, underscoring the critical importance of mastering core networking concepts to pass.
If you fail the exam, you can compare your report with the chart above to see where your scores for each topic are, so you can better plan your study.
Summary
Based on the above data analysis, I can express some personal opinions:
- To pass the CCNA exam, you can't have significant weaknesses in any of the six topics, especially the first three: Network Fundamentals, Network Access, and IP Connectivity. If your aim is a high score, prioritize Network Access and IP Connectivity, as these show the strongest correlation with top performance. For those struggling to pass, focus on strengthening Network Fundamentals and then balance your study across the remaining topics.
- Regarding perceived difficulty based on scores, Network Access appears to be a common weakness, with both passing and failing candidates achieving relatively low scores. While Security Fundamentals also sees lower scores, its modest weighting (15%) means it has less impact on the final result. Similarly, despite Automation and Programmability showing the best performance across all topics, its lowest weighting (10%) limits its ability to significantly boost overall scores.
Thank you for reading, I hope this will be helpful to your CCNA journey, I wish you the best results!
Exploring CCNA series
We currently offer proxy services for CCNA and CCNP exams:
✅ Zero-pressure preparation
✅ 100% pass guarantee
✅ Pay only after passing
Contact Easy4Cert today to unlock your certification success!